Image Details

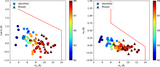
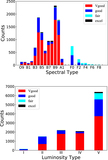
Caption: Figure 18.
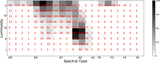
Left panel shows the distribution of the identified OB stars with Galactic latitudes larger than 20° in the luminosity class vs. spectral subtype plane. The gray level indicates the number of stars at each bin in the logarithmic scale. The right panel is similar but for the OB stars with Galactic latitudes smaller than 20°.
Other Images in This Article
Show More
Copyright and Terms & Conditions
© 2019. The American Astronomical Society. All rights reserved.
Copyright ©
2024 Astronomy Image Explorer. All Rights Reserved.