Image Details

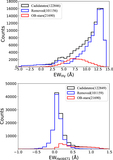
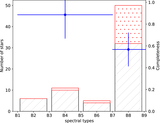
Caption: Figure 14.
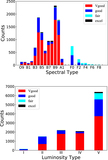
Top panel shows the histogram of the difference of the spectral subtype between the manual and MKCLASS classified results, i.e., MKCLASS−Manual class. The bottom panel shows the histogram of the difference of the luminosity class. The blue dashed lines are the mean values of the difference. The green and black dashed lines indicate the 15% and 85% percentile, respectively.
Other Images in This Article
Show More
Copyright and Terms & Conditions
© 2019. The American Astronomical Society. All rights reserved.
Copyright ©
2024 Astronomy Image Explorer. All Rights Reserved.