Image Details

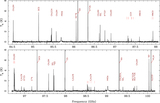
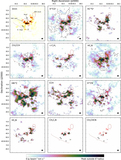
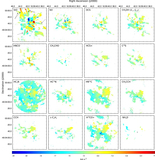
Caption: Figure 19. Emission lines
The complete figure set (175 images) is available in the online journal.
Emission lines from several molecules toward the CC core, in K (primary-beam-corrected antenna temperatures) vs. frequency (MHz). Black and red continuous lines show the data and the model whose parameters are given in Table 4. In each panel, we mark the VLSR of the model with a vertical black line and the upper-energy level of each transition. Thick green lines indicate the section of the spectra used to get the best-fit values. In panels where the peak intensity does not reach 5σ, σ = 0.06 K, we show the ±2.5σ levels using dotted black lines. Panels (a)–(d) show CH3OH, 33SO, 13CH3OH, and HC3N, respectively. The CH3OH spectrum suggests the presence of an additional and hotter component. The other emission lines toward this core and other lines of sight are available in the figure set.
Other Images in This Article
Show More
Copyright and Terms & Conditions
© 2018. The American Astronomical Society. All rights reserved.