Image Details

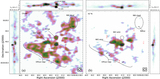
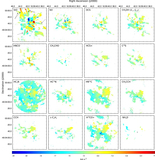
Caption: Figure 17.
Left panel: zero moment of the CS map. Dashed contours indicate the −0.03 Jy beam−1 km s−1 level. Right panel: in blue, we show the SEST CS ﹩J=2\to 1﹩ spectrum of IRAS 16562−3959 (Bronfman et al. 1996). The black and green lines show, respectively, the zero-space corrected and uncorrected CS spectra from the ALMA data cubes weighted by the SEST beam. The spectrum in red considers only the positive part of the emission from the ALMA cubes.
Other Images in This Article
Show More
Copyright and Terms & Conditions
© 2018. The American Astronomical Society. All rights reserved.
Copyright ©
2024 Astronomy Image Explorer. All Rights Reserved.