Image Details

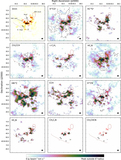
Caption: Figure 14.
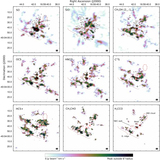
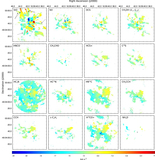
Left panel: moment zero quotient between the H13CN and HC15N ﹩J=0\to 1﹩ transitions. Right panel: moment zero quotient between the H13CN and HN13C ﹩J=0\to 1﹩ transitions. Blue contours are drawn at the 25%, 50%, and 75% of the peak H13CN moment zero emission. Cyan contours correspond to NH2D emission as in Figure 15. In both panels, we indicate the N-red, NW- and Diffuse Ridge markers as in Figure 7.
Other Images in This Article
Show More
Copyright and Terms & Conditions
© 2018. The American Astronomical Society. All rights reserved.
Copyright ©
2024 Astronomy Image Explorer. All Rights Reserved.