Image Details

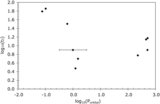
Caption: Figure 66.
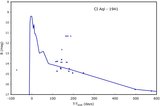
T CrB PDS. The AAVSO has a large database with essentially no gaps from 1947 to present, and this can be used create a uniformly sampled light curve and then a PDS. This allows for the unique PDS extending to frequencies lower by four orders of magnitude than any other non-RN CV. We see that the PDS has a roughly power-law shape extending to low frequencies. (The lowest frequency slope is likely not significant because there are few cycles in the data for these frequencies and so random variations in the light curve will result in deviations from the true PDS.) The slope here is −0.9, while the slope for frequencies >10 cycles per day is −1.46 on average. This is saying that T CrB shows significant variability on time scales from seconds to many decades.
Other Images in This Article
Show More
Copyright and Terms & Conditions
© 2010. The American Astronomical Society. All rights reserved.