Image Details

Caption: Figure 65.
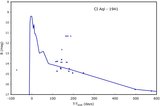
V3890 Sgr in quiescence. This long-term light curve is constructed from magnitudes corrected to the V band from the Harvard plates, the Maria Mitchell plates, the AAVSO, and from my SMARTS CCD measures in order from left to right. The open triangles represent upper limits on the brightness, while the vertical lines represent the times of the two known eruptions. A substantial problem with seeking secular changes is that the first three data sets have their detection threshold cutting off the distribution of magnitudes. But the correction for these truncation effects will only increase the amplitude of variations for the first three data sets, and the large range of variations are already inconsistent with the relatively small range seen in the SMARTS data in recent years. I think that this inconsistency is caused by the amplitude of variations being smaller in the red than in the blue. I see no confident pre-eruption rises (or dips) nor any secular trends in the brightness following eruptions.
Other Images in This Article
Show More
Copyright and Terms & Conditions
© 2010. The American Astronomical Society. All rights reserved.