Image Details

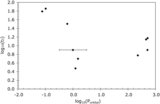
Caption: Figure 49.
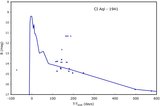
T CrB ellipsoidal oscillations. This light curve is reproduced from Zamanov et al. (2004). The figure shows the V-band magnitude as folded with a 227-day orbital period. These data are from their extensive UBV photometry of T CrB over a three-year interval. The empty circles are for points where T CrB is brighter than U = 12 mag, while the filled circles are for points with the system brighter than that limit. Note that the phase range is doubled, and that T CrB displays two minima per period. The upper curve is a sine wave fit to all their magnitudes, and thus represents both the red giant plus the accretion disk and the flickering in the hot spot. The lower curve represents the underlying red giant star contribution.
Other Images in This Article
Show More
Copyright and Terms & Conditions
© 2010. The American Astronomical Society. All rights reserved.