Image Details
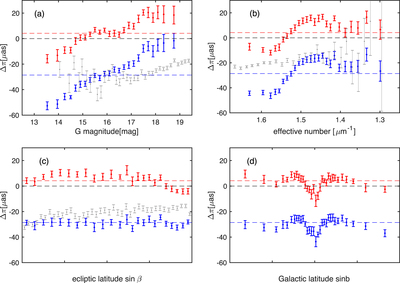
Caption: Figure 3.
Parallax differences for EWs between the Gaia EDR3 five-parameter solution and the PLR as a function of (a) G magnitude, (b) effective wavenumber, νeff, (c) ecliptic latitude, ﹩\sin \beta ﹩, (d) Galactic latitude, ﹩\sin b﹩. The blue points and error bars represent the bias in ΔπEDR3; the red symbols pertain to ﹩{\rm{\Delta }}{\pi }_{\mathrm{EDR}3}^{\mathrm{corr}}﹩, obtained from the best Gaussian fits and their standard deviations. The numbers of stars within each bin exceed 2000. Gray points are relate to our quasar control sample (Lindegren et al. 2020a, their Figure 5). The blue, red, and black dashed lines are the overall offsets in ΔπEDR3 and ﹩{\rm{\Delta }}{\pi }_{\mathrm{EDR}3}^{\mathrm{corr}}﹩, and the zero deviations, respectively.
Other Images in This Article
Copyright and Terms & Conditions
© 2021. The American Astronomical Society. All rights reserved.