Image Details
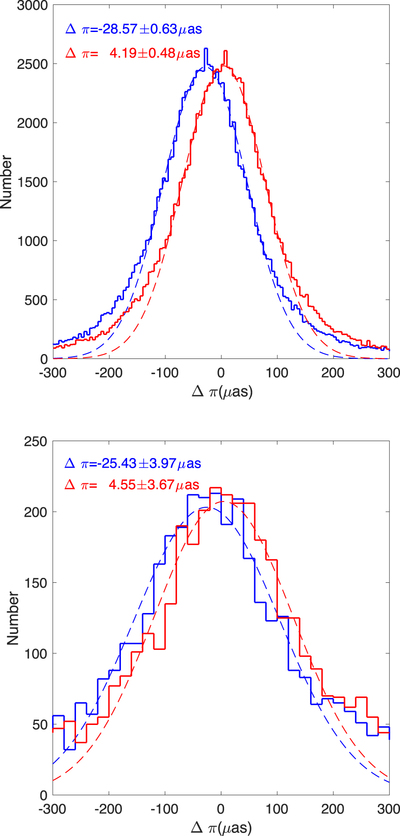
Caption: Figure 2.
Comparison of predicted parallaxes from the PLR vs. Gaia EDR3 parallaxes. (Top) Objects with five-parameter solutions. The blue and red histograms represent the (πEDR3 − πEW) and ﹩({\pi }_{\mathrm{EDR}3}^{\mathrm{corr}}-{\pi }_{\mathrm{EW}})﹩ distributions, respectively. The blue and red dashed lines represent Gaussian fits; the corresponding mean differences are indicated. (Bottom) Same as the top panel, but for six-parameter solutions.
Other Images in This Article
Copyright and Terms & Conditions
© 2021. The American Astronomical Society. All rights reserved.
Copyright ©
2026 Astronomy Image Explorer. All Rights Reserved.