Image Details
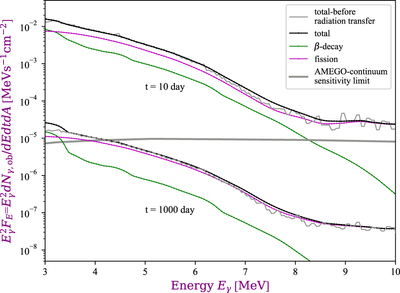
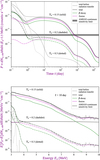
Caption: Figure 3.
Gamma-ray spectra at 10 and 1000 days given very neutron-rich ejecta from an NSM located at 10 kpc. Gray lines show the total prompt gamma-ray signal emitted, while black lines show the total signal after our radiation transfer calculation. Green lines show the contribution from β-decays to the observable gamma-ray signal, while the purple lines show the contribution from fission. The gray shaded band shows the sensitivity limit range for the AMEGO detector.
Other Images in This Article
Copyright and Terms & Conditions
© 2020. The American Astronomical Society. All rights reserved.
Copyright ©
2024 Astronomy Image Explorer. All Rights Reserved.