Image Details
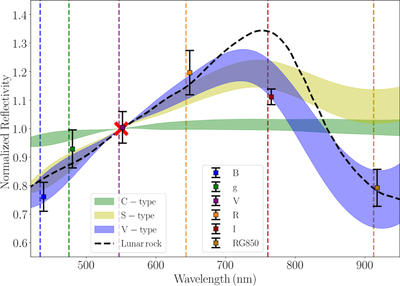
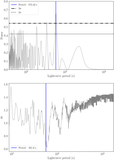
Caption: Figure 3.
Reflectance photometric spectrum of 2020 CD3 consisting of B, g, V, R, I, and RG850 observations of 2020 CD3 on 2020 March 23 UTC. The λeff locations of the B, g, V, R, I, and RG850 filters have been plotted as vertical dashed lines. The data points for the normalized reflectivity of 2020 CD3 have been offset slightly from their location in the wavelength direction. The error bars on the spectrum data points correspond to 1σ uncertainty. The spectrum has been normalized to unity at 550 nm, indicated by the red cross. The spectral range of S-, V-, and C-type asteroids from the Bus–DeMeo asteroid taxonomic catalog (DeMeo et al. 2009) is overplotted, with the V-type spectrum most closely resembling the spectra of 2020 CD3. The average spectrum of coarse bulk lunar rock samples is plotted for reference (Isaacson et al. 2011).
Other Images in This Article
Copyright and Terms & Conditions
© 2020. The American Astronomical Society. All rights reserved.