Image Details
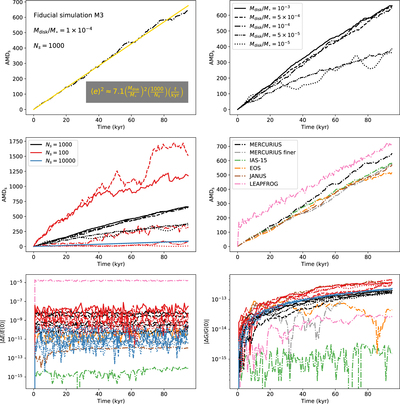
Caption: Figure 2.
Results of our numerical experiments. The time series correspond to the models listed in Table 1. Different line styles indicate different Mdisk/M⋆, and different line colors indicate analytic approximation, different Ns, or numerical setups. The first two rows correspond to dependencies on time (upper left), mass (upper right), Ns (middle left), and numerical setup (middle right). The third row shows energy (left) and angular momentum (right) errors.
Other Images in This Article
Copyright and Terms & Conditions
© 2020. The American Astronomical Society. All rights reserved.
Copyright ©
2024 Astronomy Image Explorer. All Rights Reserved.