Image Details
Caption: Figure A1.
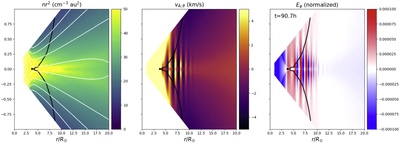
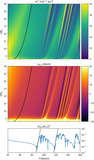
Still frame of an animation that illustrates several onsets of the tearing mode for S = 2.4 × 10⁵. The animation corresponds to the data and growth rate shown in Figure 5, but with a view close to the one in Figure 3. The toroidal electric field is shown in addition to the density and latitudinal Alfvén speed. The Alfvén surface appears in black. As in Figure 3, the aspect ratio is not respected to ease the visualization of structures at the HCS. The video begins at t = 0 and ends at t = 161.1 hr. The realtime duration of the video is 15 s.
(An animation of this figure is available.)
The video/animation of this figure is available in the online journal.
Other Images in This Article
Copyright and Terms & Conditions
© 2020. The Author(s). Published by the American Astronomical Society.