Image Details
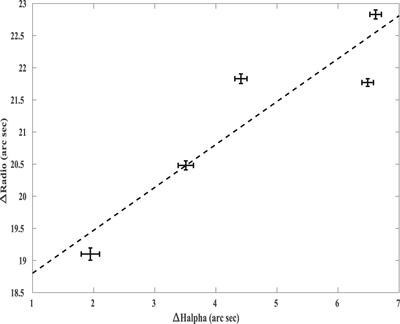
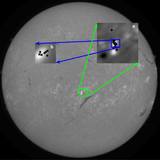
Caption: Figure 5.
Angular separations of the type III burst and Hα flare centroids (see Figure 3) from AR 12259 (located at S14W02). The dashed line is the least-squares linear fit to the data points. The fit equation is y = 0.668x + 18.13, where y is ΔRadio, and x is ΔHalpha. The correlation coefficient is ≈0.9. Note that the dimensions of the “+” symbol representing each data point indicate the 5σ errors in the radio burst and flare centroid positions, at different instances of time during the interval ≈06:48–06:54 UT.
Other Images in This Article
Copyright and Terms & Conditions
© 2020. The American Astronomical Society. All rights reserved.
Copyright ©
2024 Astronomy Image Explorer. All Rights Reserved.