Image Details
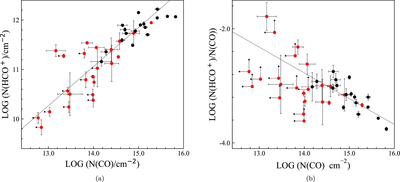
Caption: Figure 2.
(a) HCO+ column density vs. CO column density in a log–log scale. (b) ﹩N({\mathrm{HCO}}^{+})/N(\mathrm{CO})﹩ ratio vs. CO column density in a log–log scale. The red dots are from our work and black dots are from Liszt & Lucas (1998, CO column density in Table 5) and Lucas & Liszt (1996, HCO+ column density in Table 2). The black dotted lines show the fit slope to the data points from all components (upper limits are not included).
Other Images in This Article
Copyright and Terms & Conditions
© 2020. The American Astronomical Society. All rights reserved.
Copyright ©
2024 Astronomy Image Explorer. All Rights Reserved.