Image Details

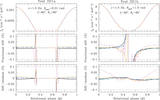
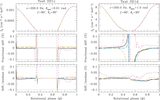
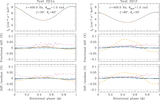
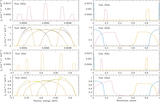
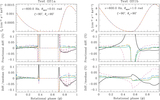
Caption: Figure 14.
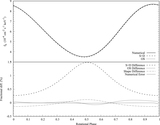
Left: results of the emission line tests OS1k and OS1l (from top to bottom, respectively) for five representative spin phases (ϕ = 0.25, 0.125, 0, 0.75, and 0.875, in order of increasing photon energy of the observed line) for the CU (black), IM (yellow), GSFC-M (orange), GSFC-S (blue), and AB (purple) codes. The spikiness evident in the spectra at some phases for the CU and IM codes is produced due to inexact interpolation of the line profiles. Right: monochromatic pulse profiles for the OS1k and OS1l tests at energies 0.75 keV at ϕ ≈ 0.125 (from IM code, marked in yellow), 0.8 keV at ϕ ≈ 0.0 (from GSFC-S code, marked in blue), and 0.9 keV at ϕ ≈ 0.8 (from AB code, marked in purple). Due to the narrow band nature of the emission lines, at a given photon energy in the observer rest frame the spot emission is only observed at some rotational phases.
Other Images in This Article
Show More
Copyright and Terms & Conditions
© 2019. The American Astronomical Society. All rights reserved.