Image Details
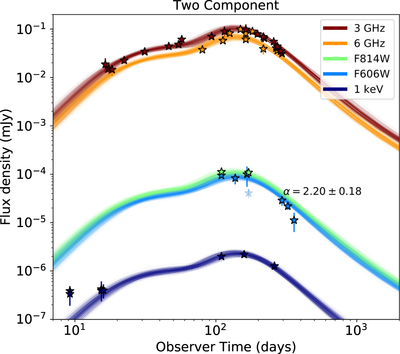
Caption: Figure 2.
Model light curves for 400 randomly selected parameter sets from an MCMC for Model (A). The stars represent the data points and the error bars are 1σ (error bars may be hidden by the markers). Light curves at 3 GHz, 6 GHz, 3.8 × 10¹⁴ Hz (F814W), 5.1 × 10¹⁴ Hz (F606W), and 1 keV are shown. The decline index α between 260 and 300 days is annotated. The faint point at ∼170 days shows the anomalous F606W point discussed in Section 2.
Other Images in This Article

Copyright and Terms & Conditions
© 2019. The American Astronomical Society. All rights reserved.
Copyright ©
2024 Astronomy Image Explorer. All Rights Reserved.