Image Details
Caption: Figure 1.
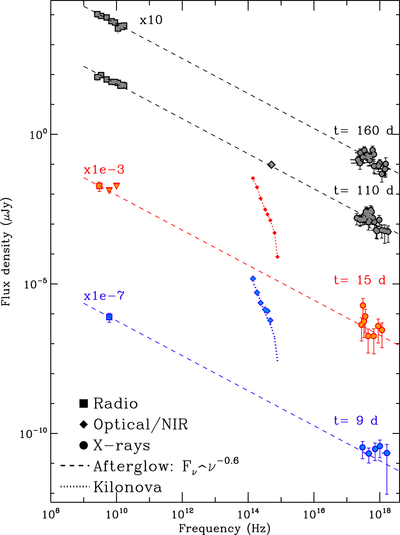
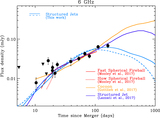
Evolution of the broadband radio-to-X-ray spectral energy distribution (SED) of GW170817 from 9 days until 160 days since merger. The radio and X-ray data are dominated by non-thermal synchrotron emission from the GW170817 afterglow at all times and consistently track each other on a Fν ∝ ν−0.6 spectral power-law segment. At early times t ≤ 15 days the optical-near-infrared (NIR) is dominated by radioactively powered emission from the KN. By day 110 the KN component has faded away and the detected optical-NIR emission is dominated by the Fν ∝ ν−0.6 afterglow radiation. Filled circles: CXO data. Filled squares: Karl J. Jansky Very Large Array (VLA). Note that while Hallinan et al. (2017) consider their 6 GHz measurement at ∼10 days only as a potential detection, here we show that it does naturally lie on the ∝ν−0.6 extrapolation of the X-ray data, which suggests that this is in fact a real detection (and the earliest radio detection of GW170817). Filled diamonds at 15 and 9 days: optical-NIR data from Villar et al. (2017). For day 9 we show the actual data from Tanvir et al. (2017), Soares-Santos et al. (2017), Cowperthwaite et al. (2017), and Kasliwal et al. (2017), while for days 15 we show the extrapolated values from the best-fitting model from Villar et al. (2017). Black dashed line: ﹩{F}_{\nu }\,\propto \,{\nu }^{-{\beta }_{{XR}}}﹩ afterglow component with βXR = 0.6 that best fits the observations at 110 and 160 days. Dashed red and blue lines: same afterglow model renormalized to match the observed flux level at 15 and 9 days. Dotted line: best-fitting KN component. The SED at 15 and 9 days have been rescaled for displaying purposes. The Hubble Space Telescope (HST) observations from Lyman et al. (2018) obtained at 110 days (filled diamonds) are shown here for comparison but have not been used in our fits.
Other Images in This Article
Copyright and Terms & Conditions
© 2018. The American Astronomical Society. All rights reserved.