Image Details
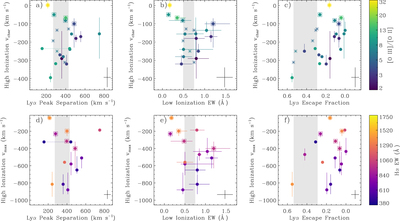
Caption: Figure 1.
Top panels show the median ﹩{v}_{\mathrm{char}}﹩ of high-ionization absorption lines (Si III λ1206 and Si IV λλ1394,1403) as a function of indirect optical depth diagnostics ((a) ﹩{\rm{\Delta }}{v}_{\mathrm{Ly}\alpha }﹩, (b) median low-ionization EW, and (c) ﹩{f}_{\mathrm{esc}}^{\mathrm{Ly}\alpha }﹩). Color indicates [O III]/[O II]. Bottom panels show the median ﹩{v}_{\max }﹩ of the high-ionization lines as a function of the same diagnostics, with color indicating Hα EW. Optical depth increases to the right in all panels. Data points and error bars show the median and range, respectively, of the lines observed in a given GP. The objects with the five lowest ﹩{v}_{\mathrm{char}}﹩ values are surrounded by open symbols and suggest an inverse trend, with slower velocities at lower optical depths; the open circle indicates J1608. For J0808's triple-peaked Lyα profile, we show both values of ﹩{\rm{\Delta }}{v}_{\mathrm{Ly}\alpha }﹩ connected with a dotted line. The black error bar in the corner indicates the typical errors on individual line measurements. Gray bands show the range of ﹩{\rm{\Delta }}{v}_{\mathrm{Ly}\alpha }﹩, Si II λ1260 EWs, and ﹩{f}_{\mathrm{esc}}^{\mathrm{Ly}\alpha }﹩ observed in the confirmed LyC-emitting GPs (Chisholm et al. 2017; Verhamme et al. 2017), which are plotted with asterisks.
Other Images in This Article
Copyright and Terms & Conditions
© 2017. The American Astronomical Society. All rights reserved.