Image Details
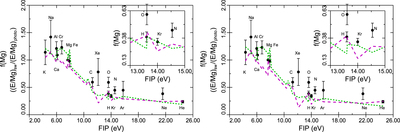
Caption: Figure 3.
Modeled fractionation patterns for Models 1 (left; low MDF) and 2 (right; high MDF) from Table 1. In each plot, the short dashed green line shows fractionation due to the ponderomotive acceleration alone, and the long dashed purple curve shows the effect of ponderomotive acceleration and adiabatic invariant conservation. Symbols with error bars show results from Genesis data analysis. Model 2 assumes a higher mass-dependent fractionation from the adiabatic invariant conservation. Model results for Kr and Xe assume the same ionization balance as for Ar.
Other Images in This Article
Copyright and Terms & Conditions
© 2017. The American Astronomical Society. All rights reserved.
Copyright ©
2024 Astronomy Image Explorer. All Rights Reserved.