Image Details
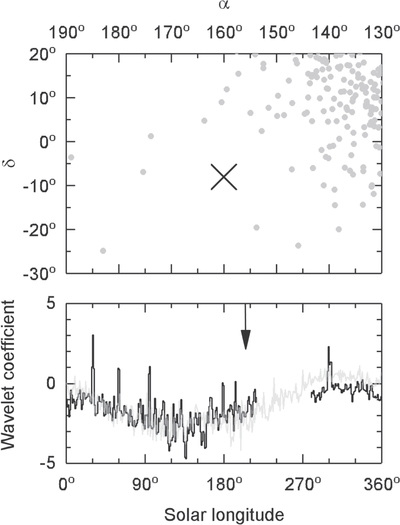
Caption: Figure 3.
Upper panel: distribution of geocentric meteor radiants within ±10% of the predicted speed (﹩{v}_{{\rm{G}}}=65﹩ km s−1) within the interval 2017 October 17–19 UT around the location of the predicted theoretical radiant for any meteor activity that might be associated with ‘Oumuamua. This theoretical radiant is marked with a cross. Lower panel: change of the wavelet coefficient (a proxy of meteoroid flux in arbitrary units) from 2017 January 1 to October 31 (black curve) and 2002–2016 (gray curve), with the predicted timing of the meteor activity originated from ‘Oumuamua marked by an arrow.
Other Images in This Article
Copyright and Terms & Conditions
© 2017. The American Astronomical Society. All rights reserved.
Copyright ©
2024 Astronomy Image Explorer. All Rights Reserved.