Image Details
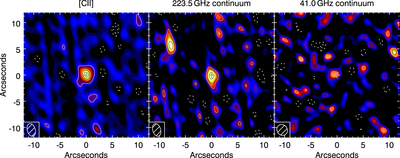
Caption: Figure 2.
Maps of the [C II] emission (left), the continuum emission at 223.5 GHz (middle), and the continuum at 41.0 GHz of J1342+0928. The [C II] map was created by averaging the continuum-subtracted datacube over 455 km s−1 (﹩2.8\times {\sigma }_{[{\rm{C}}{\rm{II}}]}﹩). The cross indicates the near-infrared position of the quasar. The beam is overplotted in the bottom left corner of each map. The contours show the emission at levels −3σ and −2σ (dotted lines) and +2σ, +3σ, +5σ, +7σ, and +9σ (solid lines), where the σ denotes the noise in the image (247 μJy beam−1, 73 μJy beam−1, and 5.7 μJy beam−1, respectively). The nearby millimeter continuum source (Section 2.1) can be seen toward the northeast in the middle panel.
Other Images in This Article

Copyright and Terms & Conditions
© 2017. The American Astronomical Society. All rights reserved.