Image Details
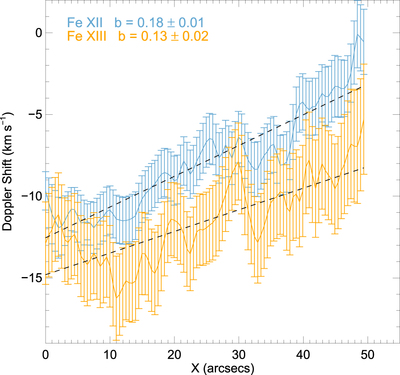
Caption: Figure 4.
Longitudinal velocity profiles for Fe XII and Fe XIII along the dotted line in Figure 3. The origin of the X axis represents the bottom of the dotted line. The dashed line is the linear fit for each profile. “b” represents the slope of the fit and its ﹩1-\sigma ﹩ uncertainty. The uncertainty for the rest wavelength estimation is ﹩\sim 5\,\mathrm{km}\,{{\rm{s}}}^{-1}﹩ for both lines, which would shift the entire profiles up or down.
Other Images in This Article
Copyright and Terms & Conditions
© 2017. The American Astronomical Society. All rights reserved.
Copyright ©
2024 Astronomy Image Explorer. All Rights Reserved.