Image Details
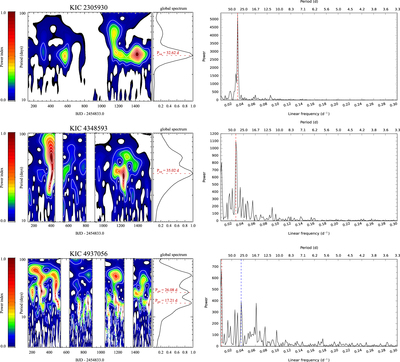
Caption: Figure 2.
Left: wavelet local and global spectra of Kepler giant stars (from top to bottom) KIC 2305930, KIC 4348593, and KIC 4937056. The rotation periods are illustrated by a red dashed line in the global spectrum. For KIC 4937056, two possible rotation periods are considered since each one is persistent in different time intervals. Contour levels are 90%, 80%, 70%,…, 20%, and 10% of the map maximum. Right: respective Lomb–Scargle periodograms for the same giant stars. The selected period and the periods having a higher power were marked with a vertical dashed line (in some cases, the higher peak did not reflect a physical variability) as follows: first, second, and third peaks are marked with red, blue, and green, respectively. The x-axis represents linear frequency, while the auxiliary upper x-axis represents period. The y-axis represents the power of the periodogram.
Other Images in This Article
Copyright and Terms & Conditions
© 2015. The American Astronomical Society. All rights reserved.