Image Details
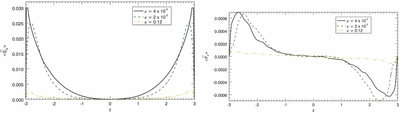
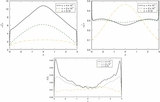
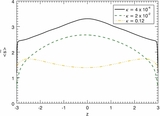
Caption: Figure 4.
Horizontally and time-averaged profiles of the rate of buoyancy work E s and vertical kinetic energy flux F k as functions of z. The three cases correspond to values of κ equal to 4 × 10 −4 (solid, black lines), 2 × 10 −2 (dashed, green lines), and 1.2 × 10 −1 (dash-dotted, yellow lines), respectively.
Other Images in This Article
Copyright and Terms & Conditions
© 2013. The American Astronomical Society. All rights reserved.
Copyright ©
2026 Astronomy Image Explorer. All Rights Reserved.