Image Details
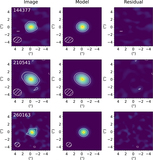
Caption: Figure 9.
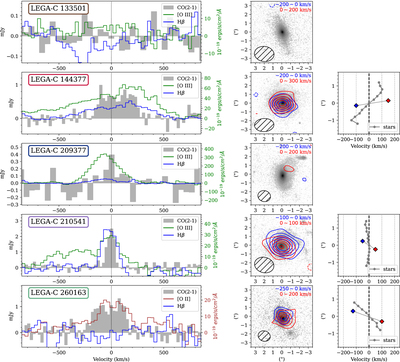
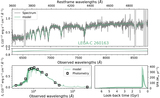
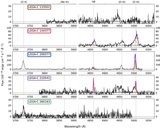
Kinematics of CO, ionized gas, and stars. First column: the spectra of CO(2-1) (gray), Hβ (blue), [O III] (green), and [O II] (brown) of post-starburst galaxies. The CO spectra are extracted in a 4″ × 4″ squared region located at the optical centers of galaxies. The spectra of LEGA-C 144377, 210541, and 260163 are binned to ∼25 km s−1. The rest two are binned to ∼50 km s−1 for presentation. The kinematics of CO(2-1) and ionized gas are decoupled. Middle column: the spatial distributions of red- and blueshifted CO emission overplotted on the HST F814W images. Contours are every 3σ. The centroids of blue- and redshifted CO emission show small displacements. Right column: comparison of the stellar (gray circles) and CO (colored squares) velocities. The positions of CO are the centroids measured from Gaussian fits (see the main text) projected in the north–south direction. The velocity gradients of CO are in the same direction as the stars but stronger.
Other Images in This Article
Show More
Copyright and Terms & Conditions
© 2023. The Author(s). Published by the American Astronomical Society.