Image Details
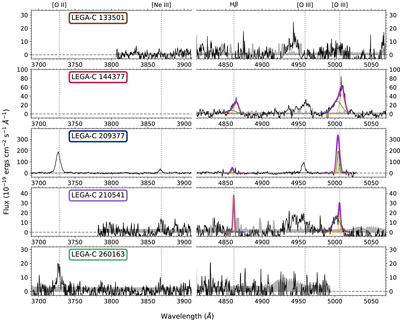
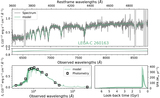
Caption: Figure 6.
The continuum-subtracted spectra of post-starburst galaxies. The thick magenta lines are the best-fit multiple Gaussian models to the Hβ and [O III]λ5007 lines. Thin orange, green, and gray lines are individual Gaussian components. The [O III]λ5007 lines show asymmetric broad components.
Other Images in This Article

Show More
Copyright and Terms & Conditions
© 2023. The Author(s). Published by the American Astronomical Society.
Copyright ©
2026 Astronomy Image Explorer. All Rights Reserved.