Image Details
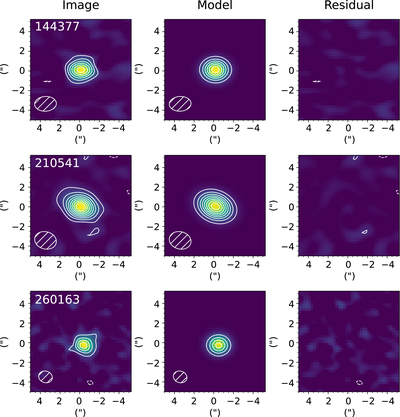
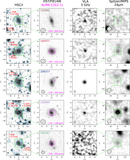
Caption: Figure 4.
The moment 0 maps of CO(2-1) and best-fit Gaussian models. Contours increase every 3σ, starting from 3σ, where σ is measured from the central 3′ of the residual maps. The beam sizes are plotted at the lower-left corners. All three CO(2-1) emissions can be modeled by a single Gaussian component, with no clear sign of disturbed morphology or outflow under the current resolution.
Other Images in This Article

Show More
Copyright and Terms & Conditions
© 2023. The Author(s). Published by the American Astronomical Society.
Copyright ©
2026 Astronomy Image Explorer. All Rights Reserved.