Image Details
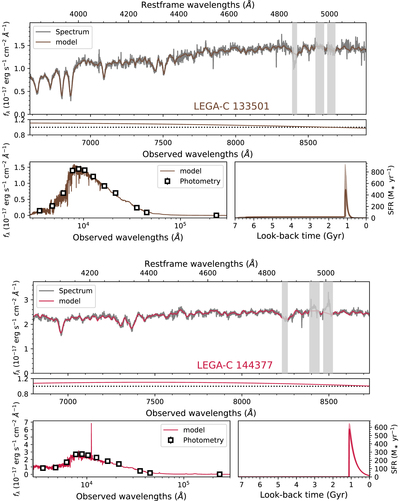
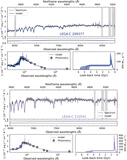
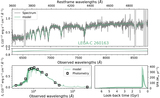
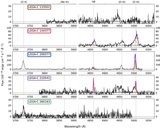
Caption: Figure 2.
The observed spectrum and photometry of LEGA-C 210541 and the best-fit model spectrum. Wavelength regions that may contain line emission (gray areas) are not fitted. The spectrum is multiplied by the factor shown in the middle panel to account for the mismatch to the broadband SED (see Section 2.3.1). The uncertainties of photometric measurements are smaller than the sizes of the squares in the bottom panel and thus not shown. The bottom-right panel is the SFH posteriors. The line is the median and the shaded area shows the 16th and 84th percentiles of the posteriors. The fits of other galaxies are given below.
Other Images in This Article

Show More
Copyright and Terms & Conditions
© 2023. The Author(s). Published by the American Astronomical Society.