Image Details
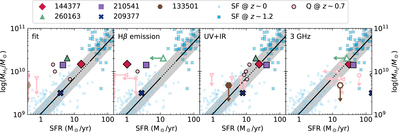
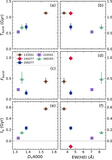
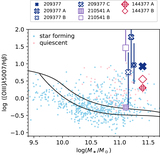
Caption: Figure 12.
The M H2/M ⊙ and SFRs of post-starburst galaxies. Each panel shows the SFR measured by different methods. Post-starburst galaxies with SFRs beyond the displayed ranges are placed at the edges of the panels. Pink circles are quiescent galaxies in Spilker et al. (2018), with SFRs measured by the same methods. Blue crosses and circles are star-forming galaxies at z ∼ 1.2 from the PHIBSS (Tacconi et al. 2013) and z ∼ 0 from the xCOLDGASS (Saintonge et al. 2011), for which the SFRs and M H2 are taken from the papers and adopting an α CO = 4. The solid line is the scaling relation between SFR and M H2 fitted with the PHIBSSS and xCOLDGASS data, and the shaded area shows a 0.2 dex scatter. SFRs of post-starburst galaxies from different methods can differ by an order of magnitude. Adopting the more reliable SFRSED, post-starburst galaxies have lower SFEs than typical star-forming galaxies.
Other Images in This Article
Show More
Copyright and Terms & Conditions
© 2023. The Author(s). Published by the American Astronomical Society.