Image Details
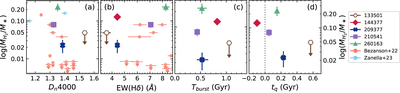
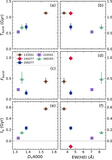
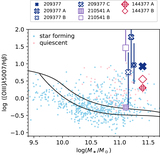
Caption: Figure 11.
The correlations between molecular gas fraction and D n 4000, EW(Hδ), lookback time of the onset of the burst, and the lookback time when galaxies became quiescent. Post-starburst galaxies at similar redshifts with CO measurements in Bezanson et al. (2022; z ∼ 0.6) and Zanella et al. (2023; z ∼ 1.2) are also plotted.
Other Images in This Article
Show More
Copyright and Terms & Conditions
© 2023. The Author(s). Published by the American Astronomical Society.
Copyright ©
2026 Astronomy Image Explorer. All Rights Reserved.