Image Details
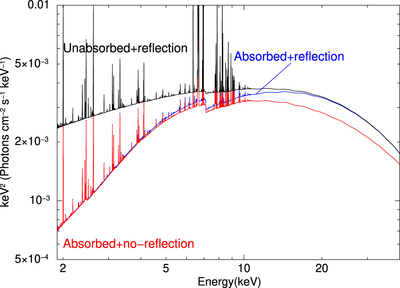
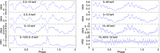
Caption: Figure 8.
Effect of complex absorber and Compton reflection in the spectral modeling. Spectral parameters from model M1-R have been used. The blue curve represents the model spectrum including both reflection and absorption. For the black curve, the absorption is set to zero, but reflection is present. The red curve denotes the spectra when absorption is present but reflection is not.
Other Images in This Article

Copyright and Terms & Conditions
© 2022. The Author(s). Published by the American Astronomical Society.
Copyright ©
2024 Astronomy Image Explorer. All Rights Reserved.