Image Details
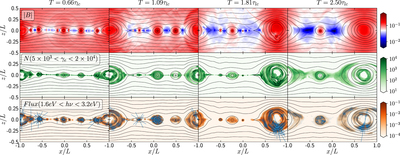
Caption: Figure 8.
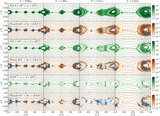
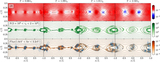
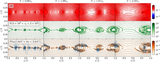
Snapshots of the spatial distributions of magnetic field strengths, nonthermal particles, and polarized emission for the run GF1 (Bg = 0.0). Blue dashes in the third row represent the relative flux and PA of the polarized emission in each cell.
Other Images in This Article

Show More
Copyright and Terms & Conditions
© 2020. The American Astronomical Society. All rights reserved.
Copyright ©
2026 Astronomy Image Explorer. All Rights Reserved.