Image Details
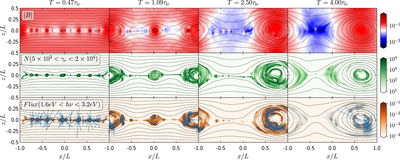
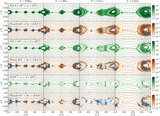
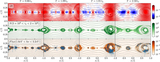
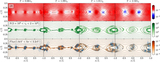
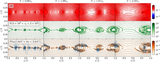
Caption: Figure 3.
Snapshots of the evolution of reconnection for the default setup. The first row is the magnetic field strength, which is plotted using the resolution of the original PIC simulation, 4096 × 2048. The second row is the spatial distribution of nonthermal particles within the given range of Lorentz factor. It is plotted after the reduction of 16 × 16 PIC cells, at the resolution of 256 × 128. The third row is the resulting polarized emission maps in the given observational band. The black lines in all panels trace the magnetic field lines. The blue dashes in the third row represent the local polarized flux; their lengths are proportional to its amplitude, and their directions illustrate the local PA.
Other Images in This Article

Show More
Copyright and Terms & Conditions
© 2020. The American Astronomical Society. All rights reserved.