Image Details
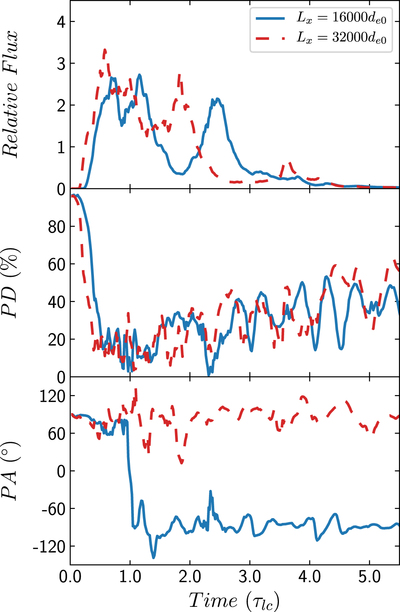
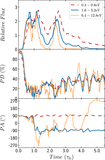
Caption: Figure 20.
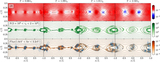
From top to bottom: optical light curves, temporal PD, and PA for different simulation box sizes (they are the default run and BS1). The light curve in the case of the larger box is rescaled by a factor of 0.5 to be in the same figure.
Other Images in This Article

Show More
Copyright and Terms & Conditions
© 2020. The American Astronomical Society. All rights reserved.
Copyright ©
2026 Astronomy Image Explorer. All Rights Reserved.