Image Details
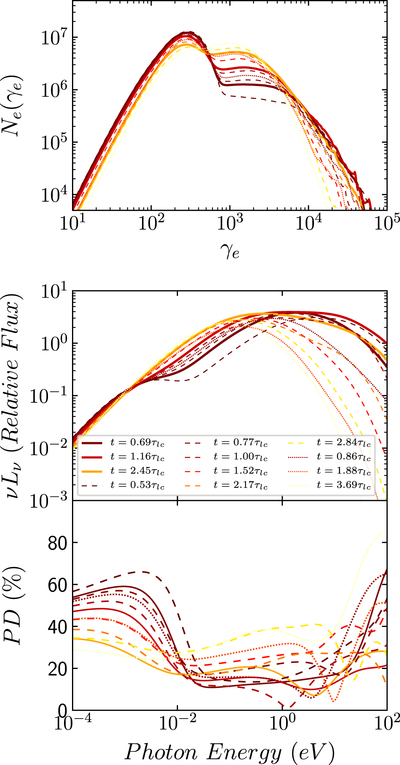
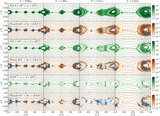
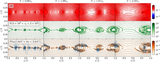
Caption: Figure 2.
From top to bottom: snapshots of particle spectra, SEDs of the synchrotron component, and frequency-dependent PDs. SEDs are plotted in relative flux. The first three bold solid lines are snapshots chosen at the peak of the light curve, the following six dashed lines are in between, the last three dotted lines are snapshots in the valleys (readers can refer to Figure 1 for the exact location). All results are presented in the observer’s frame.
Other Images in This Article

Show More
Copyright and Terms & Conditions
© 2020. The American Astronomical Society. All rights reserved.
Copyright ©
2026 Astronomy Image Explorer. All Rights Reserved.