Image Details
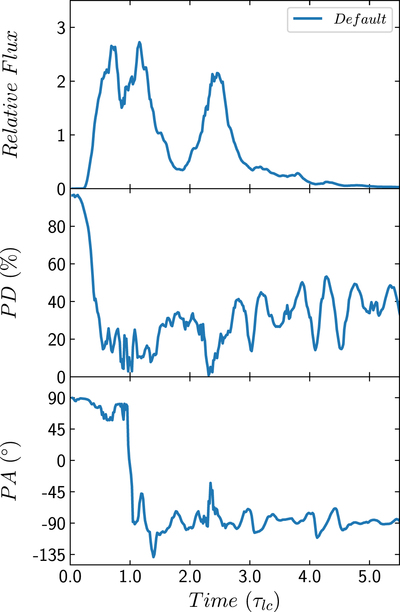
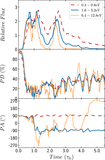
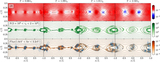
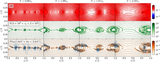
Caption: Figure 1.
From top to bottom: optical light curve, PD, and PA for our default setup. Time is in units of the light-crossing time (﹩{\tau }_{{lc}}\equiv {L}_{x}/c﹩) of the simulation box length. The light curve is plotted in relative flux. All results are presented in the observer’s frame.
Other Images in This Article
Show More
Copyright and Terms & Conditions
© 2020. The American Astronomical Society. All rights reserved.
Copyright ©
2026 Astronomy Image Explorer. All Rights Reserved.