Image Details
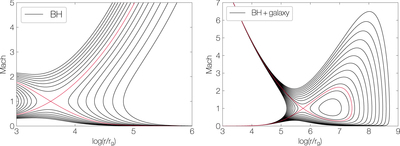
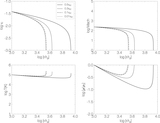
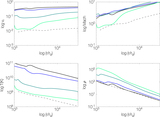
Caption: Figure 3.
Mach number of the wind as a function of radius. Different curves in each panel correspond to the same mass flux ﹩\dot{M}﹩ and angular momentum l, but different Bernoulli parameter E. The red curve in the left panel is for the “hot_bh_t” model, and the red curve in the right panel for the “hot_bhg_tb” model. Subsonic and supersonic solutions are present below and above the red curves.
Other Images in This Article
Copyright and Terms & Conditions
© 2020. The American Astronomical Society. All rights reserved.
Copyright ©
2024 Astronomy Image Explorer. All Rights Reserved.