Image Details
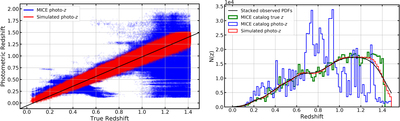
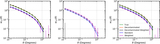
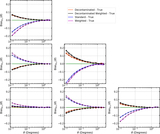
Caption: Figure 1.
Illustration of the simulated photo-zs. Left: comparison between true redshift and MICE catalog photo-zs (blue) vs. those simulated here (red). Right: comparison between the different N(z) distributions: true N(z); those based on MICE catalog photo-zs vs. those simulated assuming Gaussian PDFs with σz = 0.03(1 + z). The red, blue, and green curves are N(z) estimates from binning the respective redshifts, while the black curve is based on stacking the observed photo-z PDFs. We see that our simulated photo-zs are well-behaved and are able to recover the true N(z) effectively. These plots are created using only the galaxies with 0 ≤ R.A. ≤ 5 deg, 0 ≤ decl. ≤ 5 deg, yielding 994,863 galaxies at 0 ≤ z ≤ 1.4.
Other Images in This Article
Show More
Copyright and Terms & Conditions
© 2020. The American Astronomical Society. All rights reserved.