Image Details

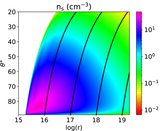
Caption: Figure 13.
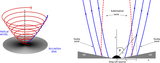
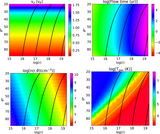
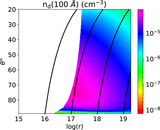
The color map shows the maximum grain sizes at a given region (﹩r,\theta ﹩) where the grains have grown by accretion of free metals in the gas along the flow lines. The black lines in the figure represent the parabolic flow lines with various starting/launch radii on the accretion disk, r0.
Other Images in This Article
Show More
Copyright and Terms & Conditions
© 2019. The American Astronomical Society. All rights reserved.
Copyright ©
2024 Astronomy Image Explorer. All Rights Reserved.