Image Details
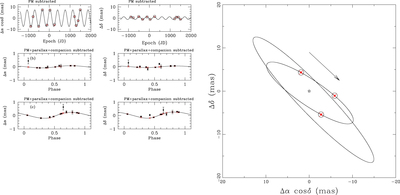
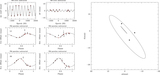
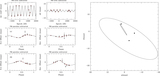
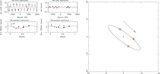
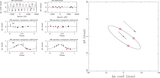
Caption: Figure 7.
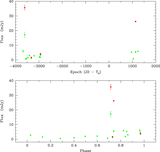
Simultaneous AGA fit of components DoAr21b and DoAr21c using the combined model, and simultaneously fitting both components (see Section 4.3). Left: the upper panels show the parallax after removing proper motions and the orbital contribution of components DoAr21b and DoAr21c. The next two panels show the orbit of the DoAr21b after removing proper motions, parallax, and the contribution of DoAr21c. The lower panels show the orbit of DoAr21c after removing proper motions, parallax, and the contribution of DoAr21b. The black dots correspond to the observed astrometric data with their error bars. The red crosses indicate the expected position at the observed epochs. The R.A. and decl. offsets are relative to the estimated barycenter position of the source. Right: the solid lines show the orbits of components DoAr21b and DoAr21c around the host star. The open circles indicate the estimated positions of DoAr21b with respect to the host star (black star at the center of the orbits), and the red crosses indicate the predicted positions along the orbit at the observed epochs. The red dots indicate the position of the observed companion. The error bars of this data points are smaller than the size of the dot. There is an excellent agreement between the observed positions and the predicted positions. The overlap of the two orbits is a projection effect due to the large inclination of the orbits and the difference in the line of nodes (Ω) of each orbit (see Table 6). The arrow indicates the direction of the movement of components DoAr21b and DoAr21c along their orbits.
Other Images in This Article
Copyright and Terms & Conditions
© 2019. The American Astronomical Society. All rights reserved.