Image Details
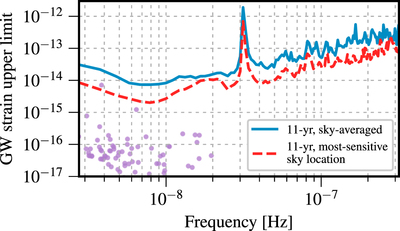
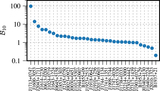
Caption: Figure 11.
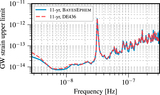
GW frequency and strain for the loudest GW sources for a sample realization of the local universe, plotted alongside our 95% strain upper limit curve. This simulation used simulated populations of nearby SMBHBs from Mingarelli et al. (2017) to determine the number of sources emitting GWs in the PTA band. For this realization, there are 87 SMBHBs—none of them lie above the sky-averaged strain upper limit curve, and there is one source that lies above the strain upper limit curve at the most sensitive sky location. This source could be detectable depending on its sky location.
Other Images in This Article

Copyright and Terms & Conditions
© 2019. The American Astronomical Society. All rights reserved.
Copyright ©
2024 Astronomy Image Explorer. All Rights Reserved.