Image Details
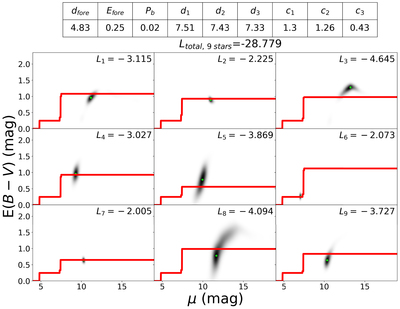
Caption: Figure 3.
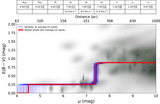
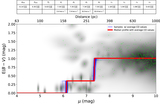
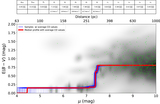
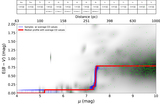
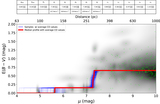
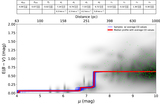
Video showing samples (summarized in the table at top) from our dynesty run toward the B5 region. The video duration is 30 s. These are not fair samples, but are intended to illustrate how variations in the reddening profile affect the log-likelihood. Nine stars (out of thousands) are selected toward the region. Each star lies in a different CO pixel, so the reddening profile varies from star to star and is dependent on the CO emission in each velocity slice corresponding to that pixel. The reddening profile is built using the sample summarized in the table at top. Individual stellar log-likelihoods (listed in the upper right corner of each panel) are calculated by integrating the reddening profile (red lines) over μ through each star’s distance–reddening posterior (background grayscale of each panel) and taking the logarithm. In each stellar posterior, the region of highest probability is marked with a lime green scatter point. The total log-likelihood for all nine stars (Ltot,9stars) is listed above the panels. The video is also available at https://youtu.be/t_iWrkB8dFQ.
(An animation of this figure is available.)
The video/animation of this figure is available in the online journal.
Other Images in This Article
Show More
Copyright and Terms & Conditions
© 2018. The American Astronomical Society. All rights reserved.