Image Details
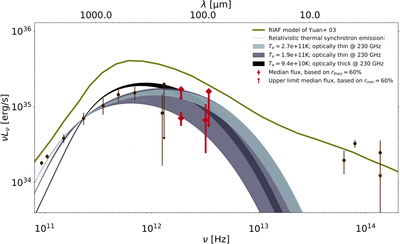
Caption: Figure 8.
RIAF model for Sgr A* compared to observations. Same as Figure 7 but without the FIR variable flux and mid-IR limits. The solid olive line is the 1D RIAF model of Yuan et al. (2003a). The set of spectra below are synchrotron spectra of a relativistic and thermal electron distribution. The width of the spectra demonstrates the slice through the parameter space of plasma β that is consistent with the observations. We show the spectra with the lowest electron temperature (Te = 9.4 × 10¹⁰ K) that is consistent with our limits as well as submillimeter measurements. At 230 GHz this spectrum is optically thick. The other two spectra shown are hotter and the plasma is optically thin. Here the peak is broad and set by ν/νc ∼ 1 and not the optical depth.
Other Images in This Article


Show More
Copyright and Terms & Conditions
© 2018. The American Astronomical Society. All rights reserved.