Image Details
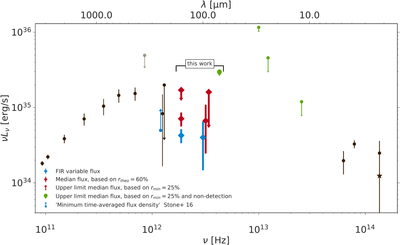
Caption: Figure 7.
An updated SED of Sgr A*: measured millimeter to submillimeter data from left to right: Brinkerink et al. (2015), Falcke et al. (1998), Bower et al. (2015), Liu et al. (2016). At ν = 890 GHz, we show the measurement of Serabyn et al. (1997) as an upper limit. This is because we believe that this measurement overestimates the flux due to exceptionally high flux at the time of the measurement. The blue point at ν = 1.2 THz is the “minimum time-averaged flux density” of Stone et al. (2016), where we have assigned an uncertainty of 0.4 Jy. Blue diamonds at ν = 1.9 THz and ν = 3.0 THz are our observed variable FIR flux. The upper limits in the THz region are based on our assumption of a minimal flux excursion of 25%. The data points below are the estimates of the median flux, based on a theoretical prediction of a 60% fractional variability. The green upper limit at ν = 4.3 THz is based on the non-detection in the blue band. The mid-IR upper limits are taken from Melia & Falcke (2001), Dodds-Eden et al. (2009), and Schödel et al. (2011). In the NIR, the points denote mean fluxes measured by Schödel et al. (2011), whereas the asterisk denotes the median reported by Dodds-Eden et al. (2010). We plot values and constraints of the quiescent/median flux in dark brown, and the brighter flux excursions (e.g., our FIR measurements) in blue. Upper limits based on non-detections are plotted in green.
Other Images in This Article


Show More
Copyright and Terms & Conditions
© 2018. The American Astronomical Society. All rights reserved.