Image Details
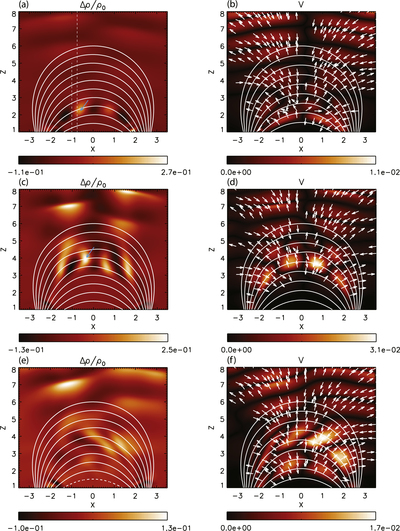
Caption: Figure 7.
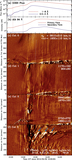
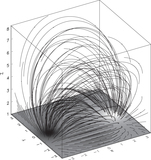
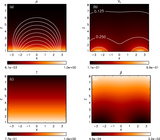
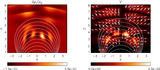
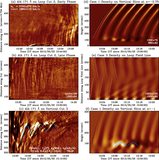
Counter-QFP-produced density (Δρ/ρ0; left) and velocity (v; right) perturbations in the x–z plane at y = 0, overlaid with magnetic field lines and velocity direction arrows (right panels only). From top to bottom are three simulation cases. (a) and (b): Case 1 at t = 119τA; (c) and (d): Case 2 at t = 98.4τA; (e) and (f): Case 3 at t = 98.3τA. The dashed lines mark the locations of the space–time cuts of the model results in Figures 9(d)–(f) below. The cyan arrows mark some of the compressions associated with the trapped slow-mode wave. An animation of panel (e) is available online.
(An animation of this figure is available.)
The video/animation of this figure is available in the online journal.
Other Images in This Article
Show More
Copyright and Terms & Conditions
© 2018. The American Astronomical Society. All rights reserved.