Image Details
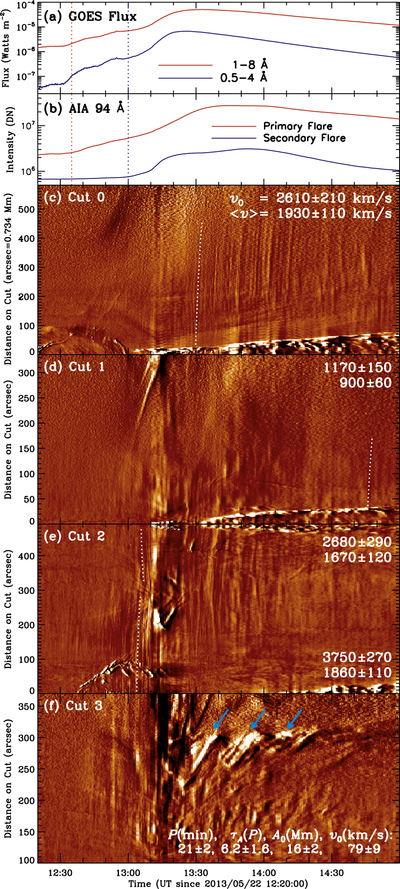
Caption: Figure 4.
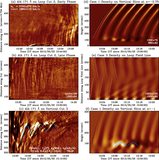
Temporary evolution of the 2013 May 22 flares and QFP waves. (a) GOES soft X-ray fluxes. (b) AIA 94 Å intensities of the primary (red) and secondary (blue) flares integrated over the boxed regions shown in Figure 1(c). The onsets of the two flares are marked by vertical dotted lines of the corresponding colors. The next four panels show running ratio space–time plots of the AIA 171 Å channel from the four cuts shown in Figure 1(c). QFPs appear as steep narrow stripes, with primarily positive slopes for the outward-propagating waves shown in panels (c) and (d) from a region that appears to correspond to open magnetic funnel Cuts 0 and 1 rooted at the two flares and both positive and negative slopes for counter-propagating waves shown in panel (e) from loop Cut 2 connecting the two flares. Distance in panel (e) is measured from the northern, main flare site. White dotted lines in panels (c)–(e) are parabolic fits to selected wave pulses, labeled with the initial speed v0 from a parabolic fit and the average speed ﹩\langle v\rangle ﹩ from a linear fit in km s−1. (f) Space–time plot from the vertical Cut 3 showing damped transverse oscillations of the trans-equatorial loops. The best-fit parameters of a typical oscillation are labeled at the bottom (from Figure 9(c)). The periodic loop intensity variations marked with the cyan arrows may contain contributions from the slow-mode waves, as suggested by the modeling results below.
Other Images in This Article
Show More
Copyright and Terms & Conditions
© 2018. The American Astronomical Society. All rights reserved.