Image Details
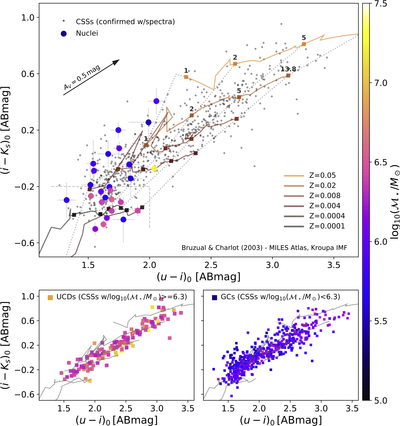
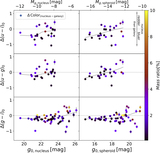
Caption: Figure 8.
Top panel: (u′ − i)0 vs. (i′ − Ks)0 color–color diagram with SSP models from BC03 using the MILES stellar library and a Kroupa IMF. Isometallicity tracks are shown as solid lines, ranging from Z = 0.0001 to 0.05 (see legend). Squares mark ages of 1, 2, 5, and 13.8 Gyr on each isometallicity track (see labels on the Z = 0.05 and Z⊙ track). These points are connected by dotted iso-age lines. Nuclei are color coded using their stellar masses as indicated by the color bar. The arrow in the top left corner shows a reddening vector of AV = 0.5 mag. Bottom panels: the left and right panels indicate the color–color relations of UCDs and GCs, respectively. Their stellar masses are color coded on the same scale as for the top panel. GC stellar masses range from 105.4 to 106.3 M⊙. UCD stellar masses range from 106.3 to 107.5 M⊙.
Other Images in This Article
Show More
Copyright and Terms & Conditions
© 2018. The American Astronomical Society. All rights reserved.