Image Details

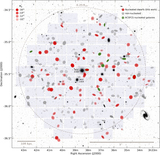
Caption: Figure 12.
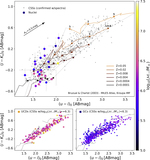
Illustration of the central region of the Fornax galaxy cluster showing the spatial distribution of nonnucleated (gray symbols) and nucleated dwarfs, which are shown as orange symbols (NGFS dEN and ACSFCS) if mass ratio information is available. Otherwise, they are shown in gray scale as well. The symbol transparency parameterizes the mass ratio as ﹩{\eta }_{n}={{ \mathcal M }}_{\mathrm{nuc}}/{{ \mathcal M }}_{\mathrm{gal}}﹩ ranging from 10% to 0.1% of the host galaxy mass, which is indicated in the top left corner. Group ﹩{ \mathcal B }﹩ nuclei (see Section 4.3), which are younger and more metal-rich than group ﹩{ \mathcal A }﹩, are shown in purple.
Other Images in This Article
Show More
Copyright and Terms & Conditions
© 2018. The American Astronomical Society. All rights reserved.